Like a lot of companies, we pay for Looker. Let’s say $150k a year, the average Looker licence1, roughly 300 seats. We are 3 data platform engineers at a company of about 500 people, and most of our week goes on the unglamorous stuff: keeping Snowflake fed, babysitting a dbt project that passed 2,000 models a while ago, and running the Airflow, Airbyte, DataHub and Kubernetes plumbing underneath it all.
In February, one of us built a thing on the side to host HTML files. It took an afternoon. 8 months later, and it’s already got as many weekly users as Looker in our company, maybe even more and Looker’s down a third.
Tech influencers keep posting about software being dead, and some say they’ve cancelled and vibecoded all their SaaS subscriptions. They say AI is going to kill B2B SaaS.2
SaaS is dead, apparently, so can we replace our enterprise BI tool?
Share of "self-hosted" GitHub repos
Meanwhile, "slop" on Hacker News
Left: share of new GitHub repos described as "self-hosted". Right: share of Hacker News comments saying "slop".3
The slop got good
A year ago I thought most AI output was slop, and most of it was. We made a few “chat with your data” demos, and they looked great on a toy schema with 4 tables, but never really worked at our scale. The SQL ran without errors, but the numbers were wrong. That’s much worse.
Then Claude Code with Opus 4.5 got really good. Like, really good. In early January adoption across the company skyrocketed. It could work in our repos and use our tools. Also, it could run a query to check the numbers before answering. That mattered a lot more than getting a clever-sounding response. Within a few weeks, people in finance, ops and marketing who had never opened a terminal were prompting all day. All of a sudden everyone was prompting, and nobody was clicking.
Around this time, Claude started spitting out a lot of HTML. You would ask for an analysis and you’d get a single file with charts, and honestly, some of those pages looked better than our Looker dashboards. The problem was that it would live in someone’s Downloads folder. To share it, they would attach it in Slack and hope. This was way before Anthropic shipped shareable artifacts for Team and Enterprise (June 2026), and we really needed a way to share this new kind of dashboard.
We needed to host and share our HTML slop
One day Maddy from our team said she’d just put them all on a web server, with an internal domain name. By the end of the day she had vibe-coded the whole thing: a small service that stored the files in S3, SSO in front of it, and (some) tests. We already run everything on Kubernetes, so deploying a service was mostly a matter of adding a Terraform module and a Helm chart. Having all that plumbing in place made the whole thing much easier.
She wrote a small Python script and packaged it in a Claude plugin. Users would get their Claude to write the HTML, the script would push it (behind SSO), and anyone in the company could open the link. Initially, the files were just plain, static HTML. In March we thought, why not, and added a live query API using the viewer’s Snowflake OAuth token: best decision of the year.
Turns out, we didn’t need to write a permission model. Snowflake already had one all along. It had roles we’d been maintaining for years, and if Snowflake says you can’t read the sales table, then neither can the dashboard. By April, Snowflake OAuth was the only login.
People loved it, for a reason that's embarrassing for the BI industry: the dashboards actually looked good.
A Looker tile is a box with a fixed list of chart types and a fixed set of colours, and it looks like every other Looker tile ever made. Ugly, and no personality.
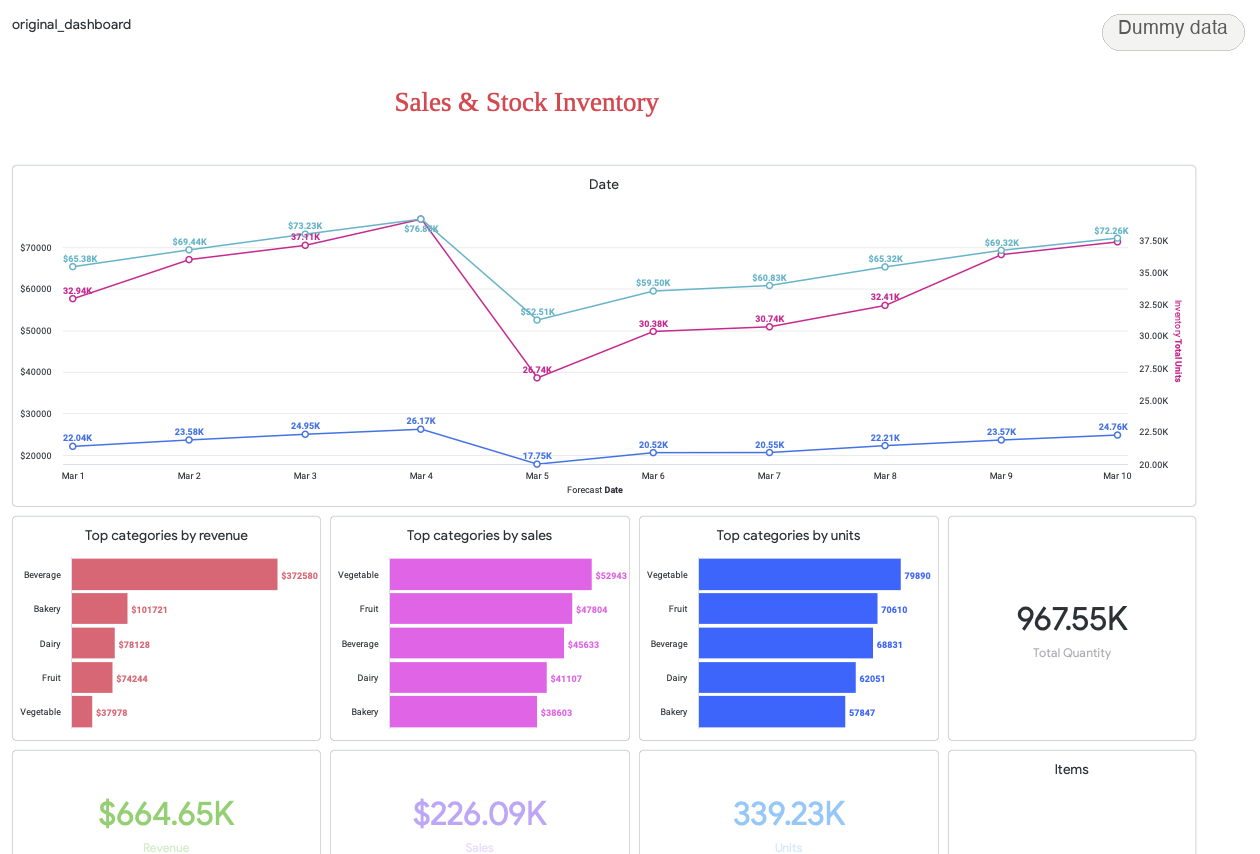
Fixed-tile, ugly Looker dashboard
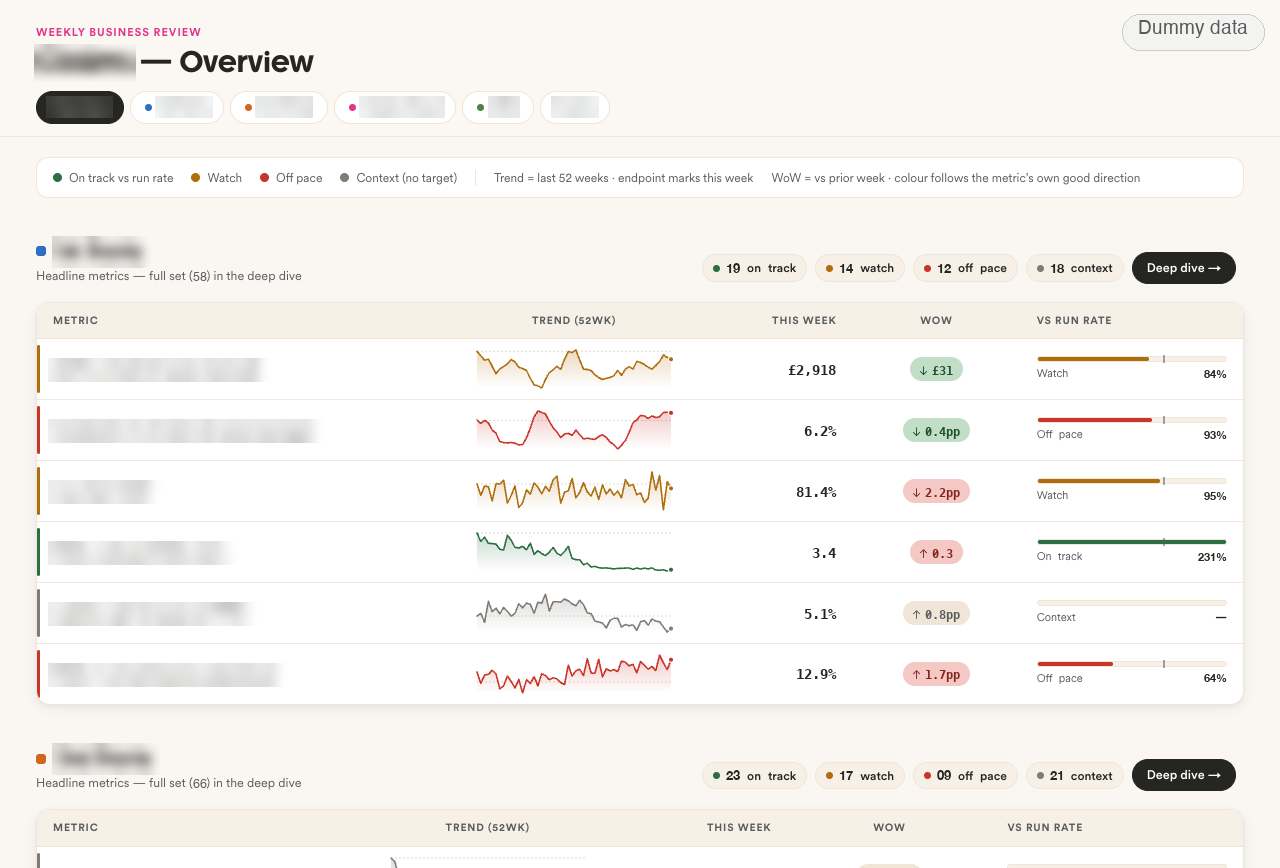
Free-form LLM-generated HTML in less than 1 minute
By getting rid of the rigid fixed tiles, our users could produce free-form HTML and prompt it until it looked neat. They loved it. Email and Slack exports came in April, parameters in May, and weekly viewers went from 23 in March to 136 in June. The exec team started to send links around. People also made the tool their own. They found use cases we would never have thought of, set dashboards to regenerate themselves on a schedule, added buttons, and built some wild designs and UX that no BI tool would have let them.
Security, at this point, was bad. Like, really bad. Dashboard JavaScript ran on the same origin as your session, nothing had permissions, and every employee could read every dashboard. It was basically one big XSS hole: any dashboard could run code as whoever opened it and pull data out in their name. We knew, and we shipped it anyway, because it was internal, behind VPN and SSO, and nothing else did this job.
OK, let’s do it properly
In our team, “let’s just build a BI tool” became a running joke. It stayed a joke for a few months, until it became clear we were in too deep. We had piled months of vibe-coding onto something with a security model we weren’t proud of, and half the company was using it. We stopped joking and said it properly: let’s build a BI tool. We got in front of a whiteboard, mostly to work out how to fix the security model, and to agree on what we didn’t want to lose: the same S3 bucket, no migration, nothing breaking for the people already using it, and publishing that stayed as easy as before.
The one thing everyone agreed on: anyone can still push any HTML in one prompt, with no review step, no template and no list of approved widgets. We’d still defend that.
Every constraint you put between people and their dashboard sends them back to the Downloads folder.
The governance that matters already happens upstream, in dbt models and Snowflake roles. So the dashboard itself can stay as loose, as fast and as good-looking as people want.
There were 4 problems to solve.
One connector instead of a script. The upload script had been copied into 2 repos and a plugin, and every copy was a bit different. We replaced all of them with one remote MCP connector for the whole company, so claude.ai, Claude Code, Claude in Slack and our own analyst agent all call the same tools. The connector passes your Snowflake token along, and the API checks who you are with SELECT CURRENT_USER(). Whatever an AI uploads lands as a draft, and a human has to click Publish.
Assume every dashboard is hostile. This is the part we needed to actually think about. The whole product is basically XSS by design: anyone can upload JavaScript that runs in a colleague’s browser, nobody reviews it, and the colleague might be the CFO. We can’t block the XSS, because the XSS is the product, so our job is to make sure it can’t reach anything. Our security model starts with “We assume it is hostile” for that reason. Each dashboard runs in a sandboxed iframe on its own origin, which gets no cookies and a strict CSP. The only thing it can talk to is the parent page, through postMessage, and the parent checks who sent the message, attaches the session and calls the API. Content tokens last an hour and work for one dashboard, one viewer and one host.
The sandbox protects the browser. We also created a separate metadata service that reads every new version of a dashboard async. It pulls out the whole HTML and the Snowflake queries. It checks for the scripts the page loads and where it sends data. Then a set of rules judges those facts. Most rules only report. They flag a dashboard that reads raw data instead of a dbt model, a script that isn’t pinned to a version, or a dashboard nobody has opened in 90 days. Some rules can block a dashboard: a script from a package nobody here has used before, or a WebRTC connection, which is the one way out that CSP can’t block. A blocked dashboard doesn’t load. The viewer sees a warning and has to accept it before the page runs.
Let Snowflake do identity and permissions. Every query runs with the viewer’s own token. Sharing a dashboard never shares data access. That’s a security feature, and it’s also a laziness feature: we never had to build or maintain data permissions, because everyone who logs in already has a Snowflake user with the right roles.
Content management. This part we vibe-coded in about a week, and it barely needed any design. For spaces, folders and sharing we copied Google Drive, because everybody already knows how Google Drive works: viewer, editor and owner, grants flow down the folder tree, and the strongest grant wins. Versions are stored by content hash, and restoring one gives you a draft. Then search, likes, scheduled exports, and teams synced from the HR system every hour. Compare that with the security model, which is where nearly all the real thinking went.
It took a few weeks of dev, and we got there.
Then it spread. People started tagging Claude in Slack threads and getting a dashboard back. Our analyst agent publishes its own, some repos publish straight from CI, and most people just publish from their own Claude, so every dashboard ends up looking a bit like the person who made it. These days it’s everywhere.
325 commits, about 74,000 lines of code (20,000 of them tests), and roughly $6.4k of Claude tokens.
That’s the whole bill on our side: 8 months, 3 engineers doing it on the side, plus a few friends who sent PRs. Claude wrote most of the code. We did the whiteboarding, argued a lot, and reviewed everything.
$0.50 a dashboard, what does that mean for BI?
People who used it, per week
Looker’s usage leaked rather than crashed. We haven’t moved everything: some teams still live in Looker, and some of its dashboards have no replacement yet. What made people use this instead of Looker is that building a dashboard stopped being expensive. That made us curious: how cheap, exactly? The good thing about paying in tokens instead of engineering time is that it’s easier to measure.
We use our analyst agent as a proxy here, because it’s a builder we can measure exactly. Every run is logged with its tokens and its cost, and every publish links back to the run that made it.
We found that each dashboard takes the agent around 1 million tokens, from the first question to the finished page. Now that we’ve moved it to Opus 5.5, the cost of a dashboard has dropped from about $2.50 to about $0.50. The agent does the same work; the tokens just got cheaper. That’s the real story: building software now costs whatever tokens cost, and that price keeps falling.
A BI tool is mostly a way to turn a query into a picture, and a picture now costs about $0.50 of tokens. It gets hard to justify a $150k licence for that part.
Weekly dashboard cost
So, build or buy?
Here’s the bill for the whole thing, from the first commit in February to now.
Running it costs about $6k a year in AWS now that it has its own database, plus whatever Claude we spend to keep adding features, which has been around $1.3k a month since July. Call it $20k a year, against $150k for Looker, and most of that $20k is us building new stuff rather than keeping the lights on.
When we bought Looker we were buying 4 things: a UI to draw charts, a permission model, a semantic layer, and somewhere to host it. Claude now draws the charts, one dashboard at a time.
Snowflake had the permissions all along, dbt has the semantics, and hosting some HTML files costs about $500 a month.
Take those away and what’s left is a $150k invoice.
We’re not the only ones, either. You hear it more and more often: solid, established businesses cancelling very expensive analytics subscriptions. Amjad Masad told Platformer the same story about Replit: once he could join the warehouse to production Postgres and build the report himself, they “canceled or downsized most of [their] analytics products”.
In our case, building a dashboard tool around our existing stack has cost a fraction of what we were paying for Looker. For us, the important bits were already in dbt and Snowflake: the models, permissions and data. Looker sat on top of that and turned it into dashboards. That’s the part we’ve found we can replace.
The bill above also leaves out the biggest cost, which is us: 3 engineers spending 8 months on this, on top of everything else a data platform team does: the pipelines, the dbt project, the warehouse, the Kubernetes clusters, the on-call. None of that stopped. We can’t put an honest number on the hours, because they were spread across everything else we did. If you need to hire a team to build this, the maths is different.
If you already have a solid platform to build on and a team that knows it well, the rest is mostly Claude's time, and Claude's time is cheap.
I’d argue the line is scale. AWS and Snowflake sell things nobody can vibe-code: data centres, storage at petabyte prices, compute that’s cheap because millions of other customers share it. I think BI is particularly exposed because a lot of its value, at least for us, was in building and presenting dashboards. Claude can now do that for pennies. Products with a real scale advantage are a different story, but I wouldn’t be surprised if more companies start replacing parts of their BI stack themselves.
What about Claude Dashboards?
Anthropic announced Claude Dashboards in beta on 8 October, a week before this went up. So the obvious question: should we have just waited and bought that?
We couldn’t really. We started 8 months ago and it didn’t exist. If we were starting from scratch today, honestly, we’d probably look at it first. It’s AI-native, and it doesn’t have the rendering problems Looker has. If your team has nothing today, it’s probably the right call.
For us, the dashboards are only part of it. The tool is wired into the way our team already works: it talks to our agent control plane, our analytics platform and Slack, with a bunch of workflows we’ve built ourselves. Claude Dashboards might cover some of that, but we’d still have to work out how to connect it all. And if a feature changes or the price goes up, we’d have to deal with it.
So it’s still the same answer. If you need software that fits what you do, and you already have a platform to run it on and a dedicated team, build it, unless the moat is scale.
- In line with the $150k average across 355 Looker deals reported by Vendr via Coefficient. ↩
- A few of the threads: AI Is Killing B2B SaaS (Feb 2026, 729 comments), AI agents are starting to eat SaaS (Dec 2025), SaaS is just vendor lock-in with better branding (Jun 2025), Every SaaS business will become a harness around a model (Oct 2026), and, for balance, why SaaS isn't doomed (Jul 2026). ↩
- Both lines start at 1× in early 2023 and are smoothed over 3 months. For GitHub we count new repos that call themselves "self-hosted" and compare them with new repos that have a real description, because GitHub is now full of empty repos made by bots. For Hacker News we count comments that say "slop" and compare them with everything posted that month. ↩